The world’s largest research marketplace
where both sides win
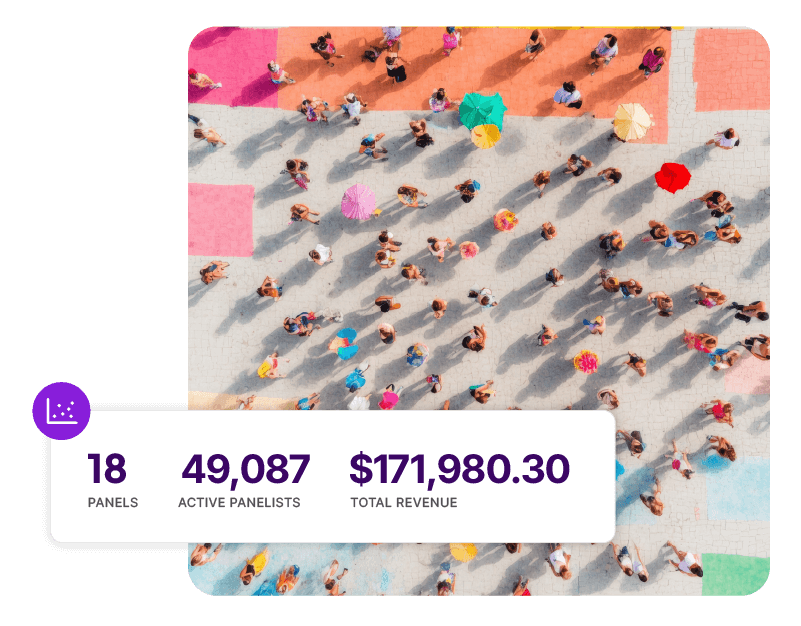
Whether you’re looking for the right respondents for your survey or for help maximizing revenue from your community, the Cint Exchange matches surveys to global respondents with ease.

How it works
A market research platform that connects the right audiences to the right questions, fast.
Research teams, agencies, platforms, and developers
You need answers from real people. Access millions of profiled respondents globally – quickly and at scale.
- Identify your audience
- Ask your question
- Launch a survey in under two minutes
- Collate high-quality responses

Where questions are answered
800+ Integrated supply partners.
600+ Exclusive panels.
130+ Countries.
80+ Languages.
Panel owners, community managers, and publishers
You have an engaged audience. Connect them to thousands of surveys – turning every completed response into revenue for your business.
- Connect your panel
- Match to live surveys
- Earn per response
- Grow your revenue
Cint Exchange for researchers
How does our market research tool get you from question to answer, faster?
Launch a study in minutes with these five steps. Already on the Cint Exchange? Log in
1.
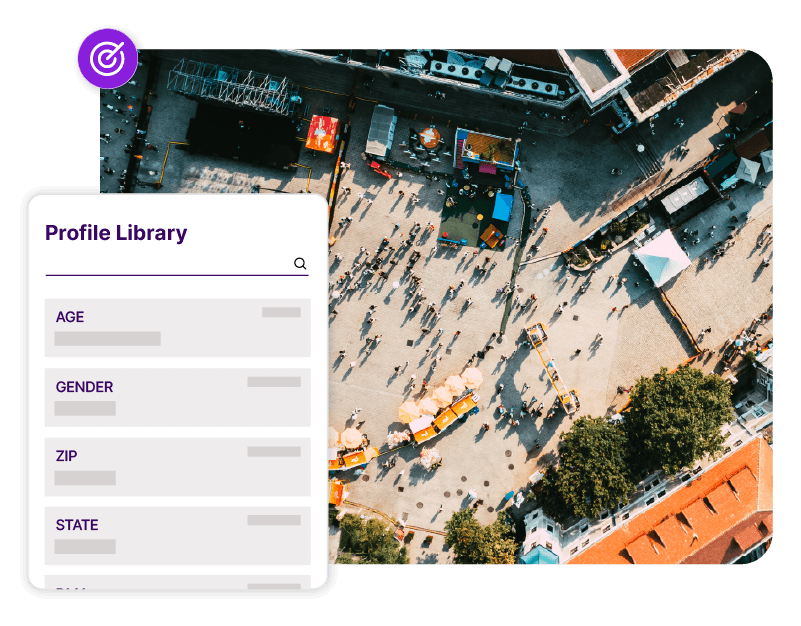
Identify your audience
Target your audience by age, gender, income, or highly niche segments you can’t find elsewhere —like cat owners in Cardiff or drone racers in Dallas. Choose from pre-defined profiles or build custom quotas in just a few clicks.
Let our feasibility forecast guide your reach, find the best time to launch with our intelligent calendar, set your budget, and you’re ready to launch.
2.
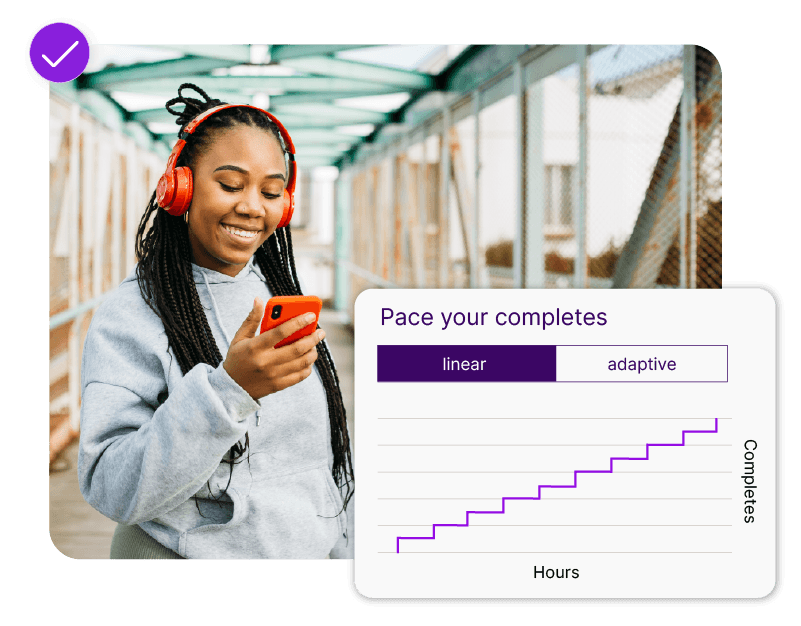
Field your study
Got other things to do? Of course you have. Our AI fielding assistant takes the strain, automatically locating the right audience within your budget to fill your study on time.
Continuous anti-fraud and attention checks are embedded in the collection process so you receive answers from highly engaged humans.
3.
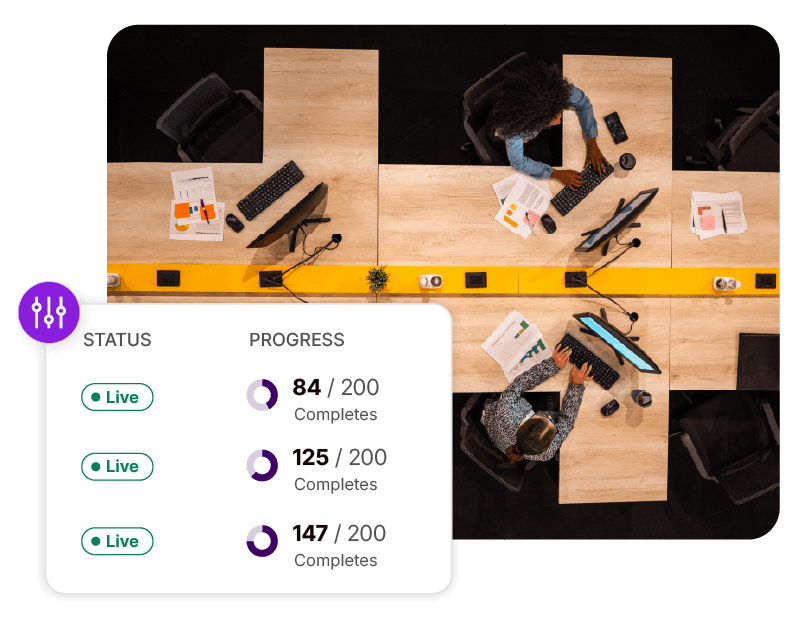
Optimize
Effortlessly manage your project health and budget during fielding.
Adjust your cost per interview to incentivize respondents and attract harder-to-reach audiences and set maximum thresholds to avoid budget creep.

4.
Analyze the insight
Results update in near real-time as completes come in.
Cross-tab by any demographic variable, filter by quality attributes, and explore response distributions with the built-in visualizer — no additional analytics tool required.
5.
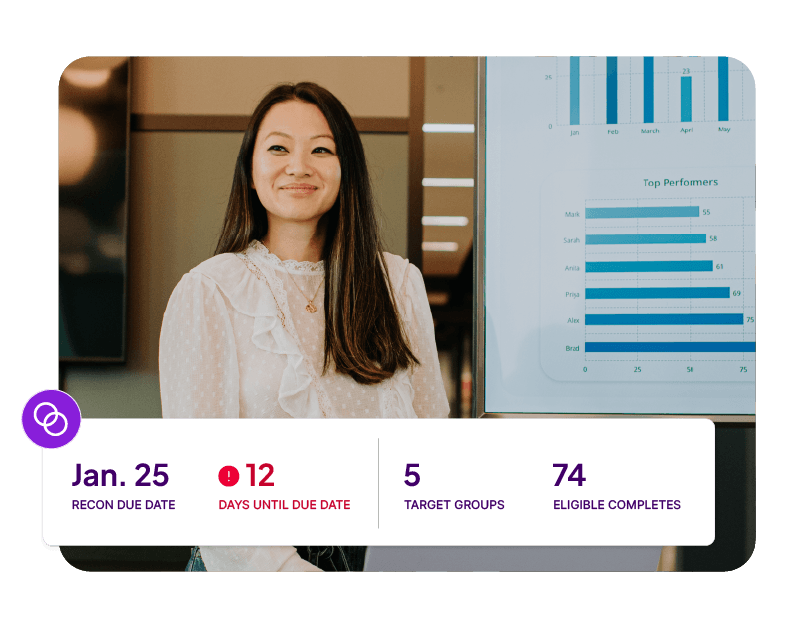
Report and reconcile
Speed up your time-to-insight with instantly downloadable, shareable reports tailored to business units down to specific target groups.
Reconcile eligible responses on the fly to avoid costly delays in your project, while fine-tuning our quality measures, future-proofing the marketplace for your next project.
Cint Exchange for community managers
Your audience is an asset.
Cint Exchange turns it into revenue
Three steps that take you from sign-up to earning.
Here’s how to connect your panel to 4,000+ active researchers.
1.
Connect your community
Programmatically integrate your panel with the Cint Exchange using our flexible supply APIs to gain instant, automated access to thousands of active global researchers.
Choose to integrate with Feed, Match, or manage your panel with Engage.


2.
Optimize your set up
Monitor your API performance metrics and audience health to continually fine-tune engagement and maximize your community’s long-term monetization potential.
3.
Monetize
Set your bid, review your targeting, and go live. Transform your verified audience’s real human insights into a secure, scalable revenue stream under a transparent cost-per-interview (CPI) model for every completed session.
From teams who already trust the Cint Exchange

“Cint has been a reliable partner, helping us to navigate through challenges and ensuring that the data collected is robust.”
Alana Devitt
Research Consultant, CoreData


“I have the confidence working with Cint, that the surveys are being completed honestly and accurately by real living, breathing people.”
Mark Wiser
Founder, Wiser Insights Group


“It’s the time to task, the cost-effectiveness and how responsive Cint is. I know that it’s not going to be a problem to get a survey up in the field by the end of the day.”
Mike Conte
Director of Survey Solutions, Marist Poll

From question to answer, faster.
Researchers
Start sourcing respondents today
Self-service UI, API integration, or managed – pick your path and launch in minutes.
Community managers
Start earning from your community
Connect your panel to 4,000+ active researchers. Every completed response becomes revenue.
Already on the exchange? Log in • Developer docs • Help center