Drop rate is one of the most important performance metrics when running an online survey. Here’s a simple definition for anyone who isn’t familiar with drop rate: it measures the number of respondents who are never redirected from the survey platform with a “final status” (complete, terminate, or overquota). In a nutshell, it tells us if respondents are abandoning surveys.
While it’s important to know if a survey is being abandoned, does drop rate really have an impact on sample buyers? It absolutely does – more than you might think.
The Importance of Drop Rate or Survey Abandonment
In order to gather high-quality data from your respondents, you need them to complete your survey in its entirety. Also known as survey abandonment rates, high drop rates could impact your study by limiting the amount of data you’re able to collect in your desired timeframe, slowing down the process.
Monitoring your survey abandonment rate is critical for understanding how your survey is performing and what changes you can make to increase survey response rates. If you know your respondents aren’t completing your survey, you can take another look and try to determine the reasons for their survey abandonment.
Here are five reasons why high drop rates are bad for both researchers and respondents.
1) Drop rate reflects respondent experience.
Drop rate should be valued for its correlation to respondent experience and data quality. Of all of the metrics available when running an online survey, drop rate is the most helpful for understanding the respondent journey.
Drops can happen for a variety of reasons – respondents abandoned the survey due to fatigue, got stuck on a broken page, or were redirected incorrectly due to a setup error. Check your survey data to see where you are losing respondents. Or, better yet, test the survey to see for yourself.
2) High drop rate could mean your survey is having technical issues and hurting data quality.
Respondents may drop from a survey when they encounter technical issues, such as a broken video, a missing button, or a mistranslated question.
Furthermore, respondents who decide not to drop when facing these challenges are often completing the survey with incomplete information, lowering the quality of their response.
3) Drop rate also tells us if a survey is designed poorly.
Similarly, drop rate may be tied to bad survey design. Repetitive questions, too many open-ends, excessive grids, and long LOIs can each cause respondent fatigue. Surveys that are not mobile optimized will also lead to poor mobile respondent experience and high rates of abandonment. Those who manage to withstand these conditions may end up rushing to finish out of frustration, resulting in poor quality responses.
4) Losing people in the survey makes your final data set less representative.
Losing lots of good respondents means the data you get from those who complete may not be representative of your intended audience. Those who get to the end only represent those with the strongest will to finish your survey.
5) Suppliers are less likely to send respondents to your survey.
Finally, as you might expect, a high drop rate hurts your survey performance because suppliers do not want to waste their respondents on a broken or frustrating survey. So, the better your survey performance metrics are, the more likely suppliers are to send respondents, and the faster your study will fill.
What Impacts Survey Abandonment?
The rate of survey abandonment is reflective of your respondent’s experience with your survey. A high drop rate could indicate that your survey is difficult for your respondents to complete, and losing respondents in your survey can result in lower-quality data. As a result, your final data may be less representative than it would be with a larger number of completed surveys.
Here are some of the main reasons for survey abandonment, leading to an unacceptable drop rate:
Poor survey design or usability: Respondents are more likely to abandon your survey if it’s unappealing or difficult to navigate. Things like technical errors, unpleasant color choices and confusing buttons could result in a poor user experience that drives respondents away.
Survey length (LOI): A survey that has too many questions or requires too much click-through will be taxing to respondents. Your survey shouldn’t take more than 5-10 minutes for your recipient to complete.
Complicated or repetitive questions: When your questions are long or complex, your respondents may give inaccurate answers or abandon the survey altogether. Questions that are rephrased and repeated throughout the survey can be frustrating for respondents.
Frequency of surveys: Sending too many surveys too close together can be overwhelming for your respondents, and they may be less likely to respond.
Often, one of the most-cited reasons respondents abandon surveys is related to functionality. Pew Research Center reports that nearly half of smartphone users mainly access the internet from their phones, and we’ve found that in the Cint Marketplace, more than 44% of all traffic is from mobile devices like smartphones or tablets. Optimizing your survey for both desktop and mobile use is an important part of ensuring your respondents have the smoothest possible user experience to complete your survey.
When you determine why your survey has a high drop rate, you’ll want to address the issues as soon as possible. Frequent respondent abandonment can hurt your data quality and extend the amount of time it takes to get the data you need to complete your research. If you’re reaching your respondents through a supplier, know that they’re less likely to send out a survey that has a high drop rate, making it harder for you to reach your intended audience.
What Does This Mean for You?
High drop rate is direct feedback from respondents that your survey should be redesigned to improve the respondent experience and increase engagement. This could also result in higher quality in your final data set, so it’s a win for you and the respondents.
Listen to your respondents – they are dropping out for a reason! This feedback should be used to help you track down the source of the drops. When a survey has a high drop rate (>20%), test it end-to-end. Walking in your respondent’s shoes is the best way to understand their experience (even if you are sure that your survey is perfect).
Bottom line: if you were a respondent, would YOU want to take your survey? If the answer is no, then it’s time to reconsider your survey design.
If you want to learn more about how to prevent a high drop rate, check out our post on respondent experience!
What Is an Average Survey Response Rate?
Survey response rate is a metric used to understand how many people responded to your survey out of who received an invitation. Generally, the average survey response rate is about 30%, meaning 30 out of 100 recipients will respond to your survey. This average can vary widely depending on your distribution method, industry, incentives and respondent relationships.
For example, research has shown a steady decrease in average response rates for telephone surveys over the past several years, with the average plateauing at 9% from 2012 through 2016. Often, a more effective way to analyze your survey response rate is to consider your own data and determine what would be the most acceptable response rate. An acceptable response rate should be one that provides the data you need to make valid, research-backed decisions about your business.
How Can You Increase Your Online Survey Response Rate?
If you find your survey has a high abandonment rate, you’ll need to determine what can be improved to make respondents more likely to complete your questions. Test your survey for usability so you can identify any issues — and address them to create a new survey that will get the responses you need.
The following are tips to increase survey completions for an underperforming survey:
Consider Your Respondents
As you work through your survey, consider your respondents’ identities. Create a survey with questions that make sense to the respondents you expect to answer. If your survey is about a specific product, you’d want to send it to people who’ve purchased that product in the past. If you send it to a respondent who doesn’t own that product, they won’t complete the survey because it’s irrelevant to them.
Revise Your Questions
Read each of your questions out loud to ensure they’re clear and concise. If a question is too complex or confusing to your respondents, they may abandon the survey or give you an answer that doesn’t accurately reflect their thoughts. Additionally, make sure your questions aren’t too invasive. Asking questions your respondents perceive as sensitive in nature may cause them to become uncomfortable and abandon the survey.
For the easiest user experience and highest response rate, choose multiple-choice questions or short-answer questions, rather than open-ended questions that require considerable consideration from your respondents.
Work On Your Invitation
In most cases, your survey invitation is an opportunity to make a first impression on your respondents and convince them to answer your questions. The invitation should be clear and well-designed, letting respondents know exactly what to expect from the survey and how their responses will be used.
Include information like how many questions they’ll need to answer and how long the survey will take. If possible, embed the survey in the invitation to give respondents easy access without having to navigate elsewhere.
Add an Incentive
Respondents are more likely to complete your survey when you reward them for their efforts. Using incentives gives them a good reason to dedicate their time to answering your questions. Incentives can include entries into raffles for a chance to win a prize, coupons or discounts or an immediate prepaid prize like snacks or gifts.
Optimize Your Formatting
Conduct a survey usability test to catch any formatting errors or technical problems that could cause trouble for your respondents. Be sure your survey is optimized for both computer and mobile use since your respondents could be using either platform to answer your survey.
Get Your Survey to More Respondents With Cint
After you’ve created, optimized and tested your survey, you’ll need to find a way to reach respondents who can answer your questions and provide high-quality data. When you work with Cint, we’ll help you gather responses by sending your survey to the right audiences. Find out more about our services and how we can help with your research by browsing our website or getting in touch with our team online.
Explore how survey design, inclusive language, and community engagement can help us create research that reflects the full diversity of human experience.
Director of Product Management at Cint, Stephanie Gall, joined the EMARKETER podcast to discuss how to make better campaign decisions in periods of flux.
Feeling the pinch but still need to deliver? A panel of experts headed by Cint’s Laura Manning discuss strategic approaches to media measurement during a period of flux.
Live at the Advertising Week Europe event in London, April 2025, Advertising Week’s Katie Ingram and Cint’s Ariel Madway took the stage to unpack generational divides.
Survey design can have a dramatic impact on the quality of your research. Download our guide to find out how to improve survey experience for respondents and reduce drop-off rates.
Brand trackers and brand lift studies are valuable insights tools for measuring consumer sentiment about a brand. Let’s explore what makes these types of studies unique and how they can most effectively be applied to your needs.
Cint’s Jimmy Snyder, Vice President of Trust and Safety, and Shelby Downes, Senior Program Manager, discuss a range of approaches for taking action against the bots.
A panel of experts voice their opinion on what difficulties insights professionals need to be aware of in the year ahead — and how best to approach them.
A panel of experts voice their opinion on how market research and insights professionals will continue to foreground automation in their methodological approach.
Introduction Across the market research industry, more and more organizations and companies are using AI to speed up audience insights analysis. The reason is simple: AI can streamline previously lengthy processes. Formerly time-consuming work can now be done in seconds, with human beings on hand to ensure accuracy. AI tools save time and money but…
Knowing how to prioritize your limited budget while increasing the impact of your digital advertising will make the difference between success and just getting by this year.
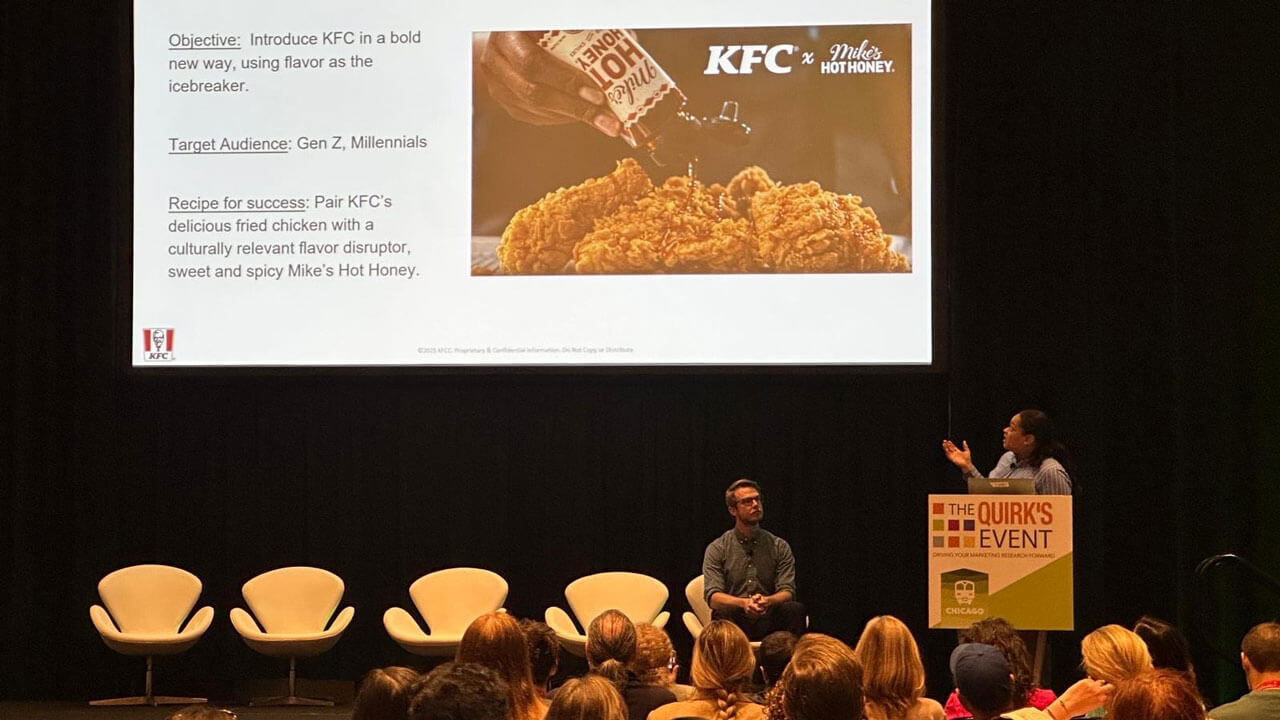
At TMRE 2024 in Orlando, KFC’s Renee Reeves joined Cint’s Ryan Fletcher for a fireside chat on how building the right tech partnerships is the (not-so-secret) recipe for fostering a culture of innovation and setting your insights team up for success.
We speak with Andy Perricone, Senior Talent Acquisition Manager at Cint to find out how Cint avoids gendered language in job ads, why it matters, and how we foster inclusivity that attracts the top talent from all genders and backgrounds.
In 2025, global advertising spend is predicted to surpass $1 trillion—a milestone so monumental it could stretch dollar bills to the sun and back. However, beneath this record-breaking number lies a complex reality: while data is abundant, marketers and agencies still face significant challenges in unlocking its full potential. A recent research collaboration between Lotame…
As the festive season approaches, travelers worldwide are packing their bags for one of the busiest travel periods of the year – but not without a little help from technology. If the idea of using AI as your personal travel assistant sounds appealing, you’re not alone. This year, holiday travel trends reveal not only a…
Cint and Advertising Week partnered on research looking into the relationship between media influence and voter behavior leading up to this year’s US and UK elections.
From ordering food online to the rise in quick commerce, our comprehensive Diwali survey reveals how technology is reshaping the way people prepare for and celebrate Diwali.
From carnival chasing to pilates, and kitesurfing to kickboxing, our international employees at Cint talk about how their hobbies keep stress under control.
A conversation with France Lasnier, SVP, for UK, France, Central Europe and Louis Nix, Senior Analyst, Product Operations, on the importance of a data-driven approach for companies.
A conversation with Cint experts Dhruv Mathur, Vice President, Information Security and Caroline Tahon, Data Protection Officer, on keeping data as safe and secure as possible.
Push Digital, a campaign agency active in America’s highest stakes races and debates by leveraging their digital expertise to start conversations, persuade audiences, and turn out voters, partnered with Cint on a study to uncover gaps in voter support.
Using CintSnap, we surveyed 300 UK respondents on how they plan to engage with the iconic celebration and what aspects of the event excite them the most.
Using CintSnap we surveyed 300 people in the UK on how they plan to engage with the Games, most watched sports, and how brand sponsorship is perceived.
Using CintSnap, we conducted a poll with approximately 300 people from the UK to explore what they read, how they read, and what persuades them to take a punt on a new title.
HR, payroll and recruitment solution specialists Employment Hero conducted a survey with Cint to delve deep into how AI assistance could be a boon for payroll professionals across Australasia.
Maintaining data ethics is critical in market research, especially with the rise of AI technologies. Transparency, compliance with regulations, and educating employees ensure consumer information is protected.
Political scientists Andrew O’Donohue and Daniel Markovits conducted a survey with Cint to understand how prosecution of Donald Trump affected public opinion among independent voters.
From London to Malaga and Cairns, Ariel Madway takes us on a journey through Cint’s busy events season, her planning inspiration and what she’s most excited about.
Both CTV and linear TV advertising present big opportunities for advertisers. In particular, the booming demand for CTV ads. We look at what the TV upfront and NewFronts are all about and the state of streaming in 2024.
In the world of market research, finding and engaging with niche audiences can feel like navigating uncharted territories. Gaining insights demands innovative strategies and streamlined processes.
When it comes to social customs and norms, few practices are as divisive as tipping expectations. We use CintSnap to survey consumer behaviour around tipping in the US and UK.
With the prestigious Academy Awards marking its 96th year, we set out to discover if the glitz and glam of ceremony still holds weight in determining viewing habits of filmgoers, as well as why people tune in, how predictions played out and who they thought should have won the coveted golden globes.
International Women’s Day is an opportunity to celebrate wins, raise awareness and get conversations going. We’ve dived into the narrative at Cint by uncovering the insights around International Women’s Day.
We’re proud to share that Cint, a global leader in market research, emerged as the leader in sample quality for online polls in a third-party study. Sapio Research, a UK market research agency, conducted the study to understand if online surveys are accurate. Sapio surveyed 2,036 UK consumers – representative by age and gender of…
For Valentine’s Day 2024, the National Retail Federation predicts that consumers will spend $25.8 billion. We used CintSnap to find out how people in the US and the UK approach this romantic season, by surveying 300 respondents.
As football fever grips the nation, the anticipation for this year’s game is reaching unprecedented heights. We surveyed the nation to understand more about how people are planning to watch, and so much more.
On the 28th of January every year, the importance of personal data, and of Personal Identifiable Information (PII) is celebrated across the world on Data Protection Day.
The Australian Open is the first of the four Grand Slam tennis tournaments to occur. We uncovered spectator experience through preferences and behaviors of our 280 respondents across Australia.
Nick Richards, Director of Product, shares an update on the work his team have been doing to comprehensively integrate every corner of product offerings on the new platform.
With the festive season well behind us, and gloomy skies looming above, January for a myriad of reasons, isn’t the most exhilarating of months. This sentiment is so nationally widespread that in 2005, a UK-based travel agency coined the term ‘Blue Monday’ to mark the most depressing day of the year.
January is a popular time for reflection and what better month to get our plans organised for the year ahead of us? A new year represents new uncharted destinations we’ve yet to discover, and for some, the usual trusted spots bring familiar comfort to recharge weary batteries.
Vishal Bhat – Program Manager, Susi Lindner – Vice President, and Sonali Kaushal – Senior Manager at Cint discuss the importance of being inclusive in language around gender.
If Taylor Swift took up the greatest amount of air space and attention in pop culture this year; the rise of artificial intelligence (AI) – and its impact on jobs – took up the greatest amount of air space and attention in professional settings.
Since there’s nothing we love more than a data driven trip down memory lane, we’ve rounded up the top 10 #CintSnaps which got the highest engagement from you this year.
When I took the reins from Tom Buehlmann on the 3rd of April of this year, the integration of Cint, Lucid, Gapfish and P2Sample was well under way – but there was still work to do. A lot of work.
Our first video in our new interview series is with Jonathan Jaynes, Senior Director of Product Design, Cint, who shares an insider’s perspective on the groundbreaking developments underway.
Our most recent CintSnap takes a festive peek into the sentiments the UK public to unveil their thoughts on this year’s Christmas ads. Join us in unwrapping the findings and discovering what makes these ads a seasonal staple for UK consumers.
When we talk about migrating customers and supply partners to our new platform, we understand that concerns may arise. In this blog post, we want to address some of the worries you may have, and give a little reassurance about the process. You’re in good hands, we promise!

 Drop rate is one of the most important performance metrics when running an online survey. Here’s a simple definition for anyone who isn’t familiar with drop rate: it measures the number of respondents who are never redirected from the survey platform with a “final status” (complete, terminate, or overquota). In a nutshell, it tells us if respondents are abandoning surveys.
While it’s important to know if a survey is being abandoned, does drop rate really have an impact on sample buyers? It absolutely does – more than you might think.
Drop rate is one of the most important performance metrics when running an online survey. Here’s a simple definition for anyone who isn’t familiar with drop rate: it measures the number of respondents who are never redirected from the survey platform with a “final status” (complete, terminate, or overquota). In a nutshell, it tells us if respondents are abandoning surveys.
While it’s important to know if a survey is being abandoned, does drop rate really have an impact on sample buyers? It absolutely does – more than you might think.